Sunday, July 31, 2011

Dr. Brett - "The Daily Trading Coach"

Last month, I read "The Daily Trading Coach - 101 Lessons For Becoming your Own Trading Psychologist" by Brett Steenbarger.  And I'm currently reading "Enhancing Trader Performance" which was the book he wrote prior to "The Daily Trading Coach."  Outstanding books.

"The Daily Trading Coach" was released a few years back in 2009, and only now have I realized what a revelation it was for me.  It seemed like just about every page had examples of things that I either had problems with, or more likely have problems with now.  And there is quote after quote in the book that were nearly identical to the "voices in my head" as I struggle and fight my way through all the challenges and obstacles to become a consistently profitable trader.

What I really appreciate is that Dr. Brett has actionable exercises or strategies he describes in order to help address the various challenges.  I've incorporated a few of his recommendations and exercises, but not to the extent I need to speed me up the learning curve at the pace I desire.

It's really interesting to read the first highlighted quote of the "Daily Trading Coach":
The enemy of change is relapse: falling back into the old, unproductive ways of thinking and behaving. Without momentum of emotion, relapse is the norm.
And the last:
 Let your strengths define your path.
It has been over 4 months since I've started day trading full time (and more), and there's a lot of data I now have to evaluate, both from the actual trades as well as my psychological behavior.  I admit, I'm feeling a bit burnt out, but mostly in a good way.  I still have the fuel of emotion driving me greater than ever, and feel more strongly than ever that I can and will change my thinking and behavior to become an elite trader.

The data I now have will also help me discover and refine the strengths that I have, so that I can better focus and build upon those strengths that will help me excel.  There are certain weaknesses I have that need to be addressed for fundamental reasons, but if the weakness I have is not on the critical path to becoming an elite trader, there's no reason why I need to waste my energy on something that will not provide a good future return.

This week, my goal is to clarify where I am, where I want to go, and how.  I will not be trading this week, especially due to some actions that caused me to call a time out.  So I will dedicate the majority of my time analyzing my historical trades and behaviors primarily through updating my new trading journal, as well as define specific goals (non-P&L related) for the upcoming month and beyond.

Friday, July 29, 2011

$WCG - another contra trade

Not sure what was going on with the health care stocks, since I don't follow the news much.  But they were gapping down in force this morning, and $WCG was one where there seemed to be relatively clean price action.  I wasn't trading today, but I was able to follow some of the price action.
$WCG 5 min
Short it!
Within the first 15 minute opening range, I admit I would have been looking to short this stock.  But the 14 day Average True Range (ATR) of this stock is about $2, so we were well beyond that figure.  When the Opening Range Low broke down, I thought it would have been a great opportunity to short.

No! Fakeout!
But something strange happens when a breakdown doesn't quite work out.  Even if there's a lot of volume, there a certain pace, movement, rhythm, cadence, that comes with a breakout that you know is going to work.  This one started to hesitate, and based on the 5th bar which turned into a doji, it was clear this wasn't going to be a breakout that dropped like a rock.

Fade it!
So when the 6th 5 min bar created a nice green hammer-like bar that rested up against the ORL, I might have taken a long since this would have been a Fade The Fakeout (FTF) type setup. This setup is still under development, but I think there is some hope for it...

If you missed it...
Miss a trade in a stock that's in-play?   Many times, you get another shot.  In this instance, the price went up sharply which created a VLCO (VWAP line cross over), which is simply when the 5ema crosses over the VWAP.  It's not a perfect indicator by any means, but once the 5ema is higher than the VWAP, I tend to look primarily for long setups (and vice versa).

...there's another one!
The price action retraced back into the retracement zone (.382% to .618% area of 15 minute opening range), and pulled back slightly.  It didn't pull back for more then 15 minutes when a new setup appears, a nice green hammer like bar at around 10:45 AM.  The high of the bar rested up against the 50% retracement level, which was also nicely lined up with the $41.50 level (I like the .50 levels).

Some considerations
I've found that a setup beyond the .618% retracement provides a better contra entry, but this one looked OK.  And the prior bar might have appeared to be a better entry spot, but the bar was red, which indicates a higher level of risk.  Some might also have balked at the nearly $0.60 sized stop loss amount with a somewhat wide spread, but hey, just go in with 100 shares and go for the experience. 

Get out, where?
If you look at the daily charts, April 7th and May 2nd were clear tops at around the $44.50-.75 area.  And the high of the first bar?  $43.87.  So somewhere up near the highs of the day would be a good place to target. 
  • First target = $43.75 area, just below the high of the day.  
  • Second target = $44.50-.75 area?
What happened?
If you take a look a 5 min chart, you'll see that there were higher lows for 11 straight bars after entry, and if you trailed your stop under the low of the prior bar, you would have gotten out on the 12th bar when the low of the prior bar was broken (below $43.83).

Assuming you let the other half ride, the price action eventually went to $44.76, which lined up nicely with the highs from April and May.  I probably would have exited around $44.50 area.

The bottom line:
I'm only going to count the pullback trade, since that's what I would have taken.  The Fade the Breakout is still under development.

First half: +$2.15
Second half: +$3.00
===============
Average profit: +$2.58

More importantly:
Initial risk was about $.60, so the reward/risk was about 4.3R. 

Not bad, looks like I picked a bad day not to trade...

$MILL - Beyond the Fib Extension (contra style)

$MILL was a stock that got some airplay today from some folks I follow on Twitter.  So even though I'm not trading today, I was able to follow along and see whether it would have resulted in any type of setup I would have taken.  Short answer, yes, it would have been a good trade.

Generally, on a gap down stock, the initial inclination is to look for short setups.  However, there are certain clues that can signal a contra setup.  One such clue is if the ORH (opening range high, generally the first 15 minutes) is broken.

In this particular example, $MILL broke out of the opening range shortly after 10:00 AM and quickly reached the 1.618 Fibonacci Extension (FE) at $4.30.  It then pulled back to the $4 level and found support.  On the 13th bar, a green hammer-like bar created the setup, and it was especially of interest since the high of the bar rested against the FE ($4.14) resistance level.
$MILL 5 min
The Setup:
This setup is one variation of what Trader-X calls Beyond the Fibonacci Extension (BTFE).  But I also add that this is a contra style (i.e. fade against the gap direction) setup.  For my trade tracking/journaling metrics, it might be more of a Pullback to the Fib Extension (PBFE) setup since it wasn't consolidating along the FE, but I'm still sorting out all out my administrative details. 

The Trigger:
  • Buy on a break above $4.14 of the 13th bar
  • Stop below $4
The Target(s):
  • $4.48 for the first half - since there's a 2.00 FE there as well as the usual $.50 natural resistance
  • $5.00 to $5.16 area - The $5 is a whole number, and $5.16 is the prior day low.  If price gets there, watch the tape/chart action and find any excuse to get out quick.
The result:
Worked pretty well. The first target was reached 15 minutes later, and the second target was reached within 30 minutes after the first.  Assuming some slippage, you would have gotten:
  • First 1/2: ~$.30
  • Second 1/2: ~$.83
  • Average: $.57
Not a bad risk/reward based on an initial stop of about $.16, which ends up being about 3.5R.

Thursday, July 28, 2011

ILMN - missed opportunities

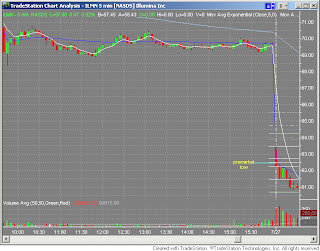
Yesterday (7/27), $ILMN turned out to be one of the trades of the day.  Unfortunately, I didn't get in the trade I describe below.  I did get a small profitable trade later in the day, but it's not much to write about.

As I continue to learn, I try to go back and review for any "tells" or setups early in the day, so that I can be prepared the next time I see a similar setup.  Here's a 5 min chart of $ILMN about 35 minutes into the day:
ILMN - 5 min chart
Here are a few thoughts regarding the first 20 minutes (first 4 bars):
  • The premarket low was broken in the first 5 minutes, which was bearish.
  • The 4th bar resulted in a slightly decending but triple overlapping bar (Tom C. wrote about this in the past)
  • The VWAP line was above the price action, providing resistance
  • There was clear support at the $61.50 area
  • TRIGGER: Sell on break of $61.50, stop above $62.25
And based on the time of the snapshot above (7th bar), here is what I'm seeing:
  • A nice narrow inverted red hammer
  • Opportunity to add to this trade (if you took the setup earlier) with a bigger position since stop size is smaller
  • $61.00 was broken (down to $60.86), the price retraced to test the $61 resistance (went as high as $61.28), and has broken back below $61.  In other words, test of the $61 resistance has failed.
  • TRIGGER: Sell on break of $60.95, stop above $61.20
Final notes:
  • I would have exited at least half the position on the sharp move down around 10:30.
  • If you never brought down the stop of the 2nd setup (above $61.20), it never would have been triggered.  
  • In fact, the $60.50 level (a VWAP and Fib level) was never broken the entire day, and the stock closed at $57.33.  
Not a bad risk/reward trade.  Now if I can only catch one of these every day...

Wednesday, July 27, 2011

Sometimes, things get wacky

Since the most recent theme has been VLB setups, here's an example of a trade in SBRA that looked like it was working, then failed miserably.  Yes, that spike on the chart is real, it's not a bad tick.  Out of nowhere, there was 200k volume on a 2 minute bar, when the average was around 10k.

This order caused the price to spike up $0.60+ (4%+), but then it came back down to earth in a matter of seconds as if nothing happened.  Blink, and you could have missed it.  Who knows, it could be all the algos, competing against one another. 
SBRA - 2 minute 2011-07-27

This was more like a C+ setup, since it only had VWAP as resistance.  But I took it for practice knowing the odds weren't as good.  My stop was above the high of 15.20, and I'm fortunate that my fill was 15.30.  I'd hate to be the person who got their buy order filled at the top tick of 15.83!

Setup: VWAP Line Bounce (VLB)

Here's an example from today of the VLB setup that I recently wrote about.

I didn't take it, but this provided a great risk/reward, especially if taken on the 2 min chart.  Risk was about 7 cents.  I would have exited 1/2 the position around 31.85ish.

Extra confidence due to:
1) VWAP was aligned pretty well with the .50 level
2) Resistance provided by the Opening Range Low (ORL)
TRN - 2 min chart

Tuesday, July 26, 2011

Online trading journals

Here's a comment I left on the Trader-X blog tonight:

Online Trading Journal

One of the challenges with tracking setups is to try and keep things as simple as possible, both for the actual journal upkeep, as well as categorizing the setups for future analysis.

I looked for a good trading journal software package, but couldn't find anything, so I've stuck with Excel.

That is, until today.  There's a new online trading journal that went live today at Tradervue.com, and it seems to have nearly everything I'm looking for. 

I really like the ability to add tags to trades, so that you can filter your analysis based on what type of trade, rating of the setup, etc.  Uploading of data is pretty simple (a TradeStation importer is currently being built, LightSpeed, IB and others already supported).

Best of all, this online trading journal is free.  Not sure if there's some other fees planned in the future, etc., but for now, it's looking pretty compelling for what I'm interested in and how I want to operate.

Here's an example of a trade I took today via Tradervue.com:

http://www.tradervue.com/shared/trades/4265

One the cons I've found to date is that it's a bit difficult to see the entry and exits on their charts, but at least they are created automatically.  It would also be nice for them to allow embedded/linked images on your journals entries, so that you can review your own screen printed charts.

We'll see if this eventually makes me switch over from Excel...
It's amazing how long it has taken for someone to create an online trading journal that's simple to use, but powerful.  There are a few packages out there, but they just didn't "feel" right, or are too costly.  TradeStation has a good trade analysis package already built in, but I believe this is a 3rd party product that they purchased at least 15+ years ago and have done little to really improve it.  It still works well, but not for daytraders or for trading journal purposes.

I'm keeping my fingers crossed that this free Tradervue product makes it.

Monday, July 25, 2011

Setup: VWAP Line Bounce (VLB) - work in progress

After experiencing what I considered a great trading day on Friday where there seemed to be so many setups that just worked (but I didn't capitalize enough on), I experienced a Monday that turned into just the opposite. There was very little I saw that made me say "WOW" so I attempted ZERO trades.

In the past, this would have bothered me. But today, I see this as growth in my ability to stay disciplined to only take high quality setups, so I'm actually feeling pretty good about this. Sure, I saw some setups that I would have taken in the past, and some actually ended up doing OK. But nothing where I had great conviction in the quality of the setup. 

I did see a few that I've been researching, and here's one that might have some potential.  It's still work in progress, so it's not quite ready for me to trade in prime time.

THE VLB SETUP
So here's a setup that I've been watching and testing over the past few weeks, it's what I call the VWAP Line Bounce (VLB) setup. It's basically a setup where a price quickly approaches the VWAP, and it'll usually have some sort of reaction. I've noticed that under certain conditions, you can take the bounce with pretty good risk/reward.

ONTY - not the best example, but it worked
Ingredients:
  • 5 min chart (you could also use a 2 min, but there's more noise to consider)
  • VWAP line
  • Candlestick charts
  • Tape reading ability (optional - see notes)
Directions:
Wait for a sharp move that heads back to the VWAP line.  If the price approaches and stalls right around the VWAP (best if it touches or passes through by a few cents), wait for the 5 minute setup bar to be completed.

It is preferred if the setup bar is narrow.  If the setup bar is too big, the 2 min time frame might present a better opportunity.  Since you are looking for the price to bounce back where it came from, place a stop order to buy/sell on the break of the setup bar.

The stop should be place just beyond the opposite side of the setup bar, or about $0.05 cents beyond the VWAP line, whichever is farther.

Take profits or move up your stop when:
  • You have at least profits double your risk (2R), or
  • You have approached a significant Fib level, or
  • You are seeing reversal candlestick patterns
Notes:
Works better on higher priced stocks, since there's usually more absolute price movement.  
Also works better if the VWAP is overlapping with one or more of the following:
  • A whole/half number
  • A Fib level
  • A significant trendline or support/resistance
Remember, if the setup bar or anything else starts to look a bit messy or not according to plan, then simply pass and move on.  Your ability to read the tape could also help you to get a more optimal price close to the turning point, especially if the 5 min chart isn't setting up with a narrow range bar. 

    Thursday, July 21, 2011

    Great video by Mike Bellafiore regarding how you bridge the gap between knowing a setup, but then executing the trade properly.  After the fact and when the markets are closed, it's always easy to play armchair trader and see exactly where you should have entered, placed your stops, exited, etc.  But at the heat of the moment, it's easy to lose sight of the "obvious" tells of a setup. 

    Here's a comment I left:
    The point you make of the gap between domain knowledge (understanding a setup or pattern) vs. executing it profitably is something I am very familiar with (I'm about 4 months into fulltime daytrading).

    It's a terrible feeling when you know what's going to happen, but you still get suboptimal results on your execution. Or worse, losing money on a trade that ends up doing just what you had expected. Ugh.

    Thanks for the great tips on how to close the gap. So far, I've found keeping a journal very effective. One metric I track is the "opportunity costs" (what I could have made/avoidance of a loss) of a trade I executed less than optimal or should not have even taken.

    It can be quite surprising/shocking to see, but a great way to learn and to keep motivated (I can see the potential of what could have been). A good day for me is if my opportunity costs are minimal or non-existent, since that means I followed my strategy well. I still have a lot of work to do, but I love the challenge.
    I have to keep in mind that even with a lot of experience and understanding I have with technical analysis of the markets, daytrading is highly execution dependent and you have to think fast.  This takes time to learn, but at least I'm building a good foundation of tools and techniques to improve myself. 

    Trading can be extremely frustrating and demoralizing, especially on days when things don't go well.  But I can honestly say that I'm enjoying the journey and look forward to the challenge ahead!

    Tuesday, July 19, 2011

    Pullback trades - what to look for

    OK, Let me test out my very first post and see how it works...

    Today, I took a few pullback trades where a new HOD (high of the day) beyond the ORH (opening range high), and the stock pulls back to either the FE (Fibonacci Extension) or the ORH (opening range high) for a buy setup. 

    Maybe 1 worked, but others failed or didn't do much.  After taking a closer look, it appears that one critical factors may be how orderly and non-overlapping the retracement bars are. 

    Here's an example at the time of setup:
    BRCM on the left was a success, LEN on the right got stopped out quickly.
    To begin, I wouldn't consider neither of these an A grade setups, but they were both similar in that they exceeded the ORH, reached the FE, created a new HOD (high of the day), and then retraced back to what appears to be a setup just above the ORH.

    Here are some of the differences:

    1) OVERLAP OF BARS
    One difference between the two stocks is the amount of overlap of the bars prior to the setup bar.  The bars leading to the setup on LEN is congested and overlapping, but BRCM has little overlap of the couple bars prior to the green hammer-like setup bar.

    2) ORDERLY vs. SHARP PULLBACK
    Another difference is that BRCM was in a consolidating channel just prior to the pullback.  One behavior that takes place regularly are multiple fakeouts and shakeouts out of tight consolidations.  In the BRCM example, you can see that there was a false breakout higher, and then it broke down below the lower channel right before the successful long setup bar appeared.  But at least it was orderly.  However, a stock that forms an inverted V top that pulls back sharply might not have the energy to turn back and resume going higher.

    3) SETUP WITHIN A CONGESTION
    Taking trades when the stock is in the middle of a congestion zone is one of my biggest weaknesses, so it's something that I'm quickly learning how to quickly identify and avoid.  There's a lot of mental and emotional capital that gets worn down when you're following a stock that's just chopping around, and I usually end up missing other trades when this is taking place.  

    TAKEAWAYS: 
    • Make sure pullback bars are orderly and have little overlap.  
    • Avoid pullbacks that are congested.
    • Avoid taking setups that are in a congested area.
     Any feedback always appreciated.

    Sunday, July 17, 2011

    Welcome!

    Welcome to the Grove Trades blog.  Yet another blog on trading?  There are so many great blogs out there of traders who have been writing quality content for so long so why me? 

    This was initially intended to be more of a private journal to help document my trials and tribulations with trading -- a tool for constant self-improvement.  But I've decided to open it up to the public since this will create a greater sense of accountability for my actions. 

    Fool myself, and I can sweep things under the rug.  Fool the public, and it's less likely you can hide.  I'm realistic that my pageviews will likely be low to nonexistent, but just knowing that someone out there might read some BS I write and call me out is incentive enough to be straight up.

    In this blog, I'll be primarily focusing on two components:
    1. Tracking various setups so that I can better understand what's currently working as well as tracking which setup works best for me (focusing on my strengths)
    2. Improving my self discipline for higher consistency
    Participation in the comments is very much welcome.  I'm always open to constructive criticism and unsolicited advice (assuming it's on topic).

    Thanks for visiting!