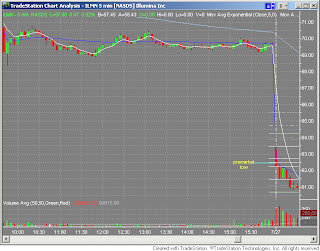
As I continue to learn, I try to go back and review for any "tells" or setups early in the day, so that I can be prepared the next time I see a similar setup. Here's a 5 min chart of $ILMN about 35 minutes into the day:
 |
| ILMN - 5 min chart |
- The premarket low was broken in the first 5 minutes, which was bearish.
- The 4th bar resulted in a slightly decending but triple overlapping bar (Tom C. wrote about this in the past)
- The VWAP line was above the price action, providing resistance
- There was clear support at the $61.50 area
- TRIGGER: Sell on break of $61.50, stop above $62.25
- A nice narrow inverted red hammer
- Opportunity to add to this trade (if you took the setup earlier) with a bigger position since stop size is smaller
- $61.00 was broken (down to $60.86), the price retraced to test the $61 resistance (went as high as $61.28), and has broken back below $61. In other words, test of the $61 resistance has failed.
- TRIGGER: Sell on break of $60.95, stop above $61.20
- I would have exited at least half the position on the sharp move down around 10:30.
- If you never brought down the stop of the 2nd setup (above $61.20), it never would have been triggered.
- In fact, the $60.50 level (a VWAP and Fib level) was never broken the entire day, and the stock closed at $57.33.

1 comment:
I saw this as a hanging man on the 9th 15m bar, nestled against the 5ema, but I didn't take it. Or I didn't see it in time. One or the other.
Post a Comment